This help file describes the advanced reporting features available to FPDS-NG users.
Topics include:
- Using the Report Toolbar for Advanced Reporting Features
- Sorting the Report Table
- Exporting Data from the Report
- Sending or Emailing the Report Data
Note: The sample screens shown in this help file are based on the Federal Contract Actions and Dollars report.
Using the Report Toolbar for Advanced Reporting Features
The report toolbar is just above the report. The toolbar includes the following tabs from which you can perform different tasks on a report:

Report Toolbar: Highlighting Tab
From this tab, you can highlight the report data to identify important data, trends, and patterns. Specifically, you can highlight metric values in the report that are above, below, or within a range.
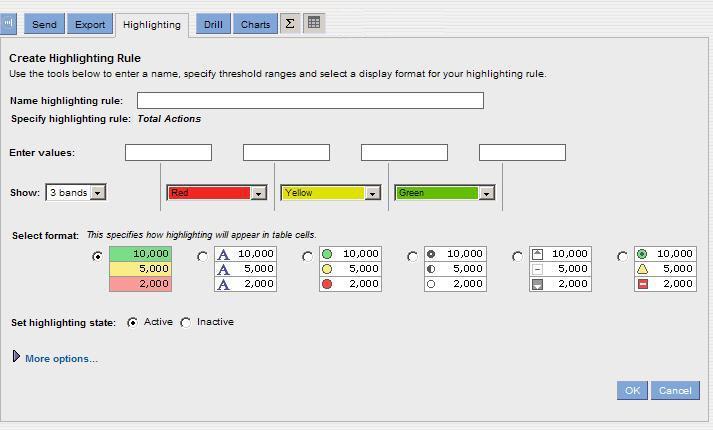
The report includes metrics called “Total Actions” and “Total Dollars Obligated”. You can highlight the values that are above, below, or within a range by creating highlighting rules.
Creating a Highlighting Rule
To create a highlighting rule: select the metrics “Total Actions” and “Total Dollars Obligated”, and click the Highlight tab. When you click the tab, the Create Highlight Rule box displays. From this box, you can:
- Enter the highlighting rule name.
- Specify the highlighting rule, for example, specify three ranges (low, medium, and high) for the values that you want to highlight.
- Set a color code for highlighting each range. You can choose the color from list box for the various ranges. You also have an option called custom where you can enter your own color code. To get this option, go to the colors list box and select the custom there. Once you select the “custom”, a text box appears. Enter the color code in Hexadecimal format.Click Help For Hexadecimal Color Codes.
- Choose a format for the highlighting rule.
- Set the state of a highlighting rule as to whether you want the highlighting to be active or inactive in your report.
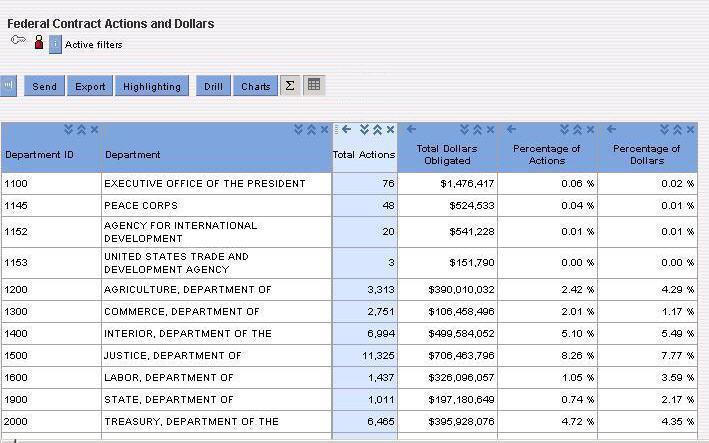
After you are finished, click OK. Your report will be displayed with highlighting.
Government Wide
All standard reports are generated Government Wide. The drill down feature accesses detailed levels of data in the system to further filter information provided on the reports.
Department
The Department label is a drill down feature that specifies the department or agency you are selecting. For example, GSA or DoD.
Agency Code
The Agency label is a drill down feature that specifies the organization or service under the department. An example would be, the Federal Supply Service of GSA or Navy of DoD.
The drill feature provides other attributes or metrics at a lower level related to the current report that is displayed. The figure shown below is a Total Contract Actions and Dollars report that id displaying data for the fiscal year 2004 at the government wide level.
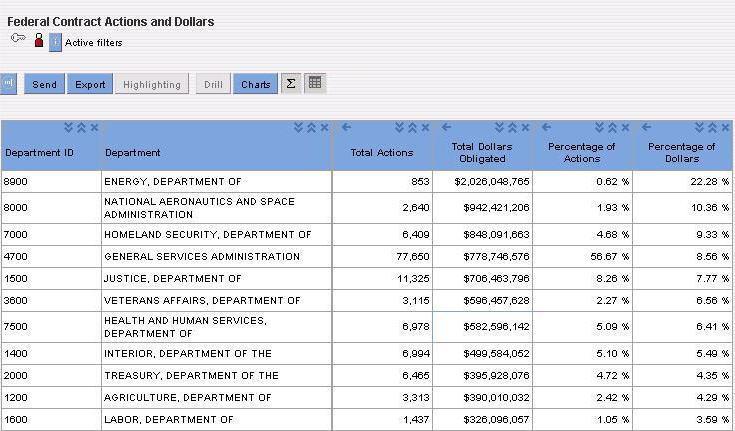
The following section Drilling into a Report explains how to shift from a general view of the report data to a more detailed view using the drill down feature.
Drilling into a Report
When drilling into a report, attribute or metric values are selected for the drill. The reporting tool uses these values as a drill filter. The drill filter determines the data seen in the drill results. More than one attribute or metric value for the drill can be selected. The following lists three ways to select multiple attribute or metric values:
- Select multiple attribute values in the report table.
- Click a metric value to select all associated attribute values.
- Click an attribute name to select all attribute values.
Steps for Drilling into a Report
To drill into a report:
1. Open the report you want to drill into. The report displays on the Analyze tab. For our purposes the Federal Contract Actions and Dollars Report displayed below is used to demonstrate the drill down function.

2. To select the attribute value for the drill click on the department name that will be used to filter the report information. The Department name “Homeland Security” shown in the following figure is highlighted to represent that it was chosen as the drill down filter.

3. To select all of the attribute values for an attribute click on the attribute name. To select more than one attribute column hold down the Ctrl key while clicking on the title of each attribute column desired.

4. To select a contiguous range of values use the shift key while clicking the attributes.

5. To select a non-continuous range of values use the Ctrl key while clicking the attributes desired.

6. Click Drill. The reporting tool displays the available drill paths on the Drill tab.

-Or-
In the report table, right-click the selected values, and then click Drill to view available drill paths.

You can select those attributes from the available drill paths that are not already part of the report. Each attribute can have one primary drill path and multiple secondary drill paths. The primary drill path allows you to follow a standard path of inquiry for the attribute.
7. From the available drill paths, select the attribute to display in the report.

For example, if the report currently displays the report government wide select the department attribute for “Homeland Security”, and then select the contracting Agency attribute to display the agencies (i.e. Coast Guard, Transportation Security Administration) for the selected department (Homeland Security). The report drill filter will show all agencies associated with “Homeland Security” for the reporting period.

8. To go back to the original report, click the Original Table link in your current drill path header shown in the figure below.

Tip: To view a description of the drill filters and the appendix of the report select the (i) icon shown in the following figure.

The appendix shown in the figure below will display with the report filter information.

Drilling into a Report with a Primary and Secondary Drill Path
After the drill filter is created, additional attributes can be selected for the report. Drilling into a report allows you to filter attribute values and see additional attributes in reports. Additional attributes are selected from a predefined drill path. The predefined drill path lists the attributes that are available for selection to display in the report.
The primary drill path allows you to follow a standard path of inquiry for the attribute. All other related drill paths appear in the report as secondary drill paths. The reporting tool displays both primary and secondary drill paths for all Metrics in a report.
Steps for Using Primary and Secondary Drill paths
1. To drill using primary and secondary drill paths select an attribute value on the report. Right click on value and select drill. The following figure shows the drill path for Homeland Security on the report.

2. To use a secondary drill path to filter further in to the report data right click on the Department “Homeland Security” and select drill. Select Vendor from the available drill path shown in the following figure.

Step 2 will select all Vendors associated with the Department of Homeland Security. This will display all Vendors for all Agencies as well. The Vendor drill down results are shown in the following figure.
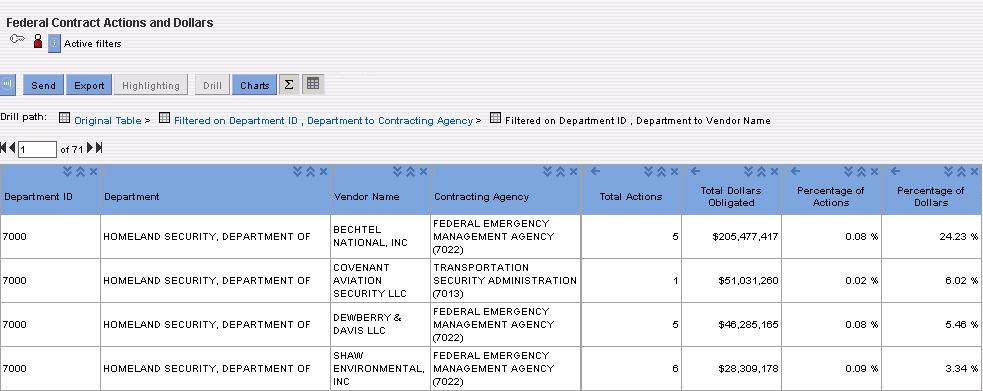
3. To sort the Vendor results and look for Vendors with multiple entries use the sort button shown in the following figure.

When sorting by Vendor the report will allow you to find a vendor used more than once by an agency more efficiently. The results of sorting by Vendor are shown below.

Drilling Using Two Primary Drill Paths
Another drill feature available in the standard reports allows you to select from two primary drill paths. When a metric is used to filter the report two drill paths are available for selection. The first drill path filters by Contracting Agency level. The Contacting Agency drill path lists the selected drill filter by each agency. The second drill path filters by Department level. The Department drill path filters by grouping the selected drill filter for agencies. The following steps are provided to show how this concept works.
Steps for Using Two Primary Drill Paths
1. Select a Department (Homeland Security will be used in this example) and drill down to the Contracting Agency level.

2. Select a metric, such as Total Dollars Obligated. Right click on the metric and select drill.
3. Select Vendor from the first available drill path shown in the following figure.

The report displays all vendor information for each selected agency shown in the following figure.

Selecting the Second Primary Drill Path
1. Select a Department (Homeland Security will be used in this example) and drill down to the Contracting Agency level.

2. Select a metric, such as Total Dollars Obligated. Right click on the metric and select drill.
3. Select Vendor from the second available drill path shown in the following figure.

The report groups all vendor information and filters by the department level. Also, for each vendor, the different agency actions and dollars are provided, if the vendor has contracts in more than one agency for the given department. The results of this filter are shown in the following figure.

When you open the report, the chart is displayed along with the report table.
Changing the Chart that Displays for a Report
If you want to change the chart type for the report, click Chart. This displays the types of charts that are available to display for your report. Click the Chart Type that you want to display. You can also select the cells that you want to plot.

You can choose the Chart position in which to display the chart: either above, below, to the right, or to the left of the table.
Click Go to display the chart for your report.
You can use the Sort buttons at the top of each column in the report table to sort report data. You can move metrics or attributes side-to-side in the report table. Attributes always appear to the left of metrics in the report table. You can also remove metrics or attributes from the report. To move or remove metrics or attributes, you must have the Interact with Data privilege.
The following shows the buttons on the report table you can use to sort, move, or remove attributes and metrics:

Once you sort a column in the report table, the Sort button displays in bold text. You can also minimize a column or resize a column in the report table. You can also sort, move, or remove attributes and metrics from the Create Report tab.
Exporting Data from the Report
From the report, you can export data to a variety of formats:
- Microsoft Excel
- Comma Separated Value (CSV) Document
- HTML Document: If the report contains any filters, you can hide the filters in the HTML document.
- PDF Document: You can export the file in the portrait or landscape orientation. For a report with sectional report tables, you can display each section on a separate page. If the report contains any filters, you can hide the filters in the PDF document. When you export the report to PDF format, PowerAnalyzer displays the report as a PDF document in a new browser window. You need Adobe Acrobat Reader Version 4.0 or later to display the report as a PDF document in a new window. If you do not have Adobe Acrobat Reader installed on your machine, PowerAnalyzer prompts you to save the report as a PDF document to your computer. After you install Adobe Acrobat Reader, you can view the PDF document.
When you export report data, PowerAnalyzer creates a file in the specified format. You can save this file to your local drive. Exporting a report to another format allows you to send the report to someone outside of your organization. You can also use the exported report in another program, such as Excel, Acrobat, or DreamWeaver.
To export report data:
1. Open the report you want to export. The report displays on the Report Preview Window. PowerAnalyzer displays cached data on the Report Preview Window for cached reports. For on-demand reports, PowerAnalyzer runs the report.
2. Click Export on the top right of the Report Preview Window. The Export window appears.
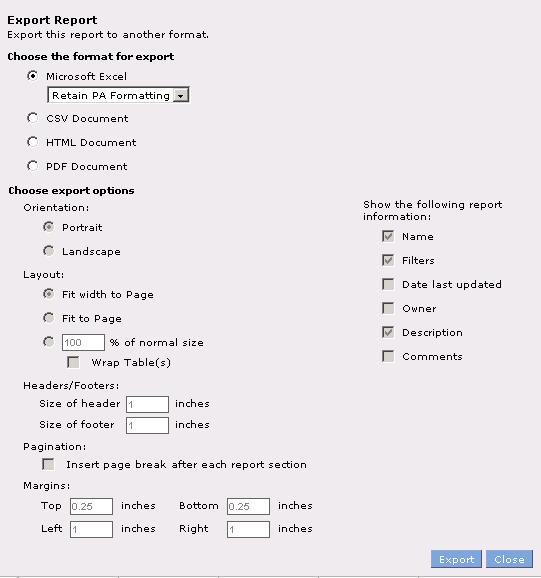
3. Select the format for export. If you select HTML format and you want to hide filters in the exported report, select the Hide Filters in Exported Report check box. If you select PDF format, select the orientation and display options.
4. Click Export.
5. Save the file to your local drive.
Note: If the report name contains a period (.) PowerAnalyzer replaces the period with an underscore (_) in the exported file name.
To export report data to Excel:
You can choose several ways to export report data to an Excel file. You can choose to retain PowerAnalyzer formatting in the Excel file or use the formatting and functions in an Excel template. You can also export the report data to an Excel PivotTable to use advanced Excel functions. The Excel file retains custom metric and formatting. When you choose the Excel PivotTable or Template options, you can refresh data in Excel. You cannot refresh data when you choose the Retain PowerAnalyzer Formatting option. To refresh data, you must first install the Microsoft SOAP toolkit on the machine where you save the Excel file. When you export report data to an Excel file, choose from the following options:
- Retain PowerAnalyzer Formatting . PowerAnalyzer creates a new Excel file and writes the report data to the file. The file retains the formatting you see in the Report Preview Window in PowerAnalyzer. You can then view and save the file.
-
Export to Excel PivotTable . PowerAnalyzer creates a new Excel PivotTable that uses a macro to refresh data. An Excel PivotTable is an interactive report that summarizes data and allows you to rotate columns and rows. The Excel PivotTable does not contain any formatting you set in PowerAnalyzer. Choose Export to Excel PivotTable if you want to use Excel to perform further analysis on the report data using advanced Excel functions. For details on using Excel PivotTable reports, see your Microsoft Excel documentation.

- Export Using Template . PowerAnalyzer creates a new Excel file based on an existing Excel template that you have uploaded in the PowerAnalyzer repository. The new Excel file contains formatting specified in the template. Choose Export Using Template if you want to standardize the format of a report table.
Note: Before you can export to an Excel PivotTable or use a template, you must set Excel to the Medium Security level permission to enable macros. You can set the security level in Excel by choosing Tools > Macros > On Security level.
Sending or Emailing the Report Data
You can email a report from the Report Preview Window or the Find tab. PowerAnalyzer attaches the report to your email in the format you select. You can attach the report in the following formats:
- PDF Document
- Embedded HTML
- Microsoft Excel
- Comma Separated Value ( CSV ) Document
Note: Before you can email a report, your PowerAnalyzer system administrator must configure a PowerAnalyzer mail server. PowerAnalyzer supports mail clients on Windows and UNIX. You can attach up to three reports or documents to your outgoing email messages. PowerAnalyzer limits the combined size of all attachments to 2 MB. To email a report as a PDF document, embedded HTML, Excel, or CSV document, you must have the Email Report Content privilege.
To email a report:
1. Open the report you want to email. The report displays on the Report Preview Window.
2. Click Send.

3.Enter the following information:
Property |
Required/Optional |
Description |
To |
Required |
Email address of the recipient. You can send the email to more than one recipient. Separate multiple email addresses by a comma (,) or a semi-colon (;). |
| Cc | Email address for carbon copying the email. You can include more than one email address. | |
| Bcc | Email address for blind carbon copying the email. You can include more than one email address. | |
| Subject | Subject of the email. | |
| Send report as | The format for the report. PowerAnalyzer sends the report as an attachment in the format you select. | |
| Text box | Body of the email. |
Report Toolbar: Show/Hide Totals Tab: 
From this tab, you can show or hide totals of the report data

Open the report. Click Show/Hide Totals tab. It will hide the totals of the report.

If you want to show the totals, click the tab again
Report Toolbar: Show/Hide Table Tab: 
From this tab, you can show or hide report table

Open the report. Click Show/Hide Table tab. It will hide the report table.

If you want to show the report table, click the tab again
Below Table lists the colors and hexadecimal color codes you can use for custom option